Convert OBJ file to PNG#
To produce images of wind turbines for visual impact assessment, the program loads .obj files and converts them into .png files. This conversion involves utilizing the view angle and wind direction to appropriately rotate the object file in the desired orientation.
Show code cell source
import os
from pathlib import Path
import sys
sys.path.append(str(Path(os.getcwd()).parent.parent))
from src.utils import print_code, load_and_normalize_obj, plot_trisurface, crop_image, adjust_image, plot_trisurface
from IPython.core.display import HTML
Initially, the program loads vertices and faces from the .obj file and normalizes them based on the total height of the wind turbine.
HTML(print_code(load_and_normalize_obj))
def load_and_normalize_obj(file_path, total_height = 1):
    V, F = [], []
    with open(file_path) as f:
        for line in f.readlines():
            if line.startswith('#'):
                continue
            values = line.split()
            if not values:
                continue
            if values[0] == 'v':
                V.append([float(x) for x in values[1:4]])
            elif values[0] == 'f' :
                F.append([int(x.split("/", 1)[0]) for x in values[1:4]])
    V, F = np.array(V), np.array(F)-1
    V = (V - np.min(V[:,2])) / (np.max(V[:,2]) - np.min(V[:,2]))*total_height
    return V, F
The vertices are represented by points in 3D space, while the faces are defined by the indices of the vertices that form the face.
V, F = load_and_normalize_obj("../../assets/turbine.obj", total_height = 1)
print("V: ",V,"\n\nF: ", F)
V:  [[-0.38323411 -0.04002556  0.67077201]
 [-0.38322772 -0.03992025  0.67064993]
 [-0.38322314 -0.04018633  0.67075629]
 ...
 [ 0.19505491 -0.03958282  0.99919489]
 [ 0.19505738 -0.03963892  0.99921006]
 [ 0.1950604  -0.03974164  0.99916952]]

F:  [[475 444 471]
 [477 492 471]
 [475 471 492]
 ...
 [388 583 348]
 [532 583 388]
 [466 532 388]]
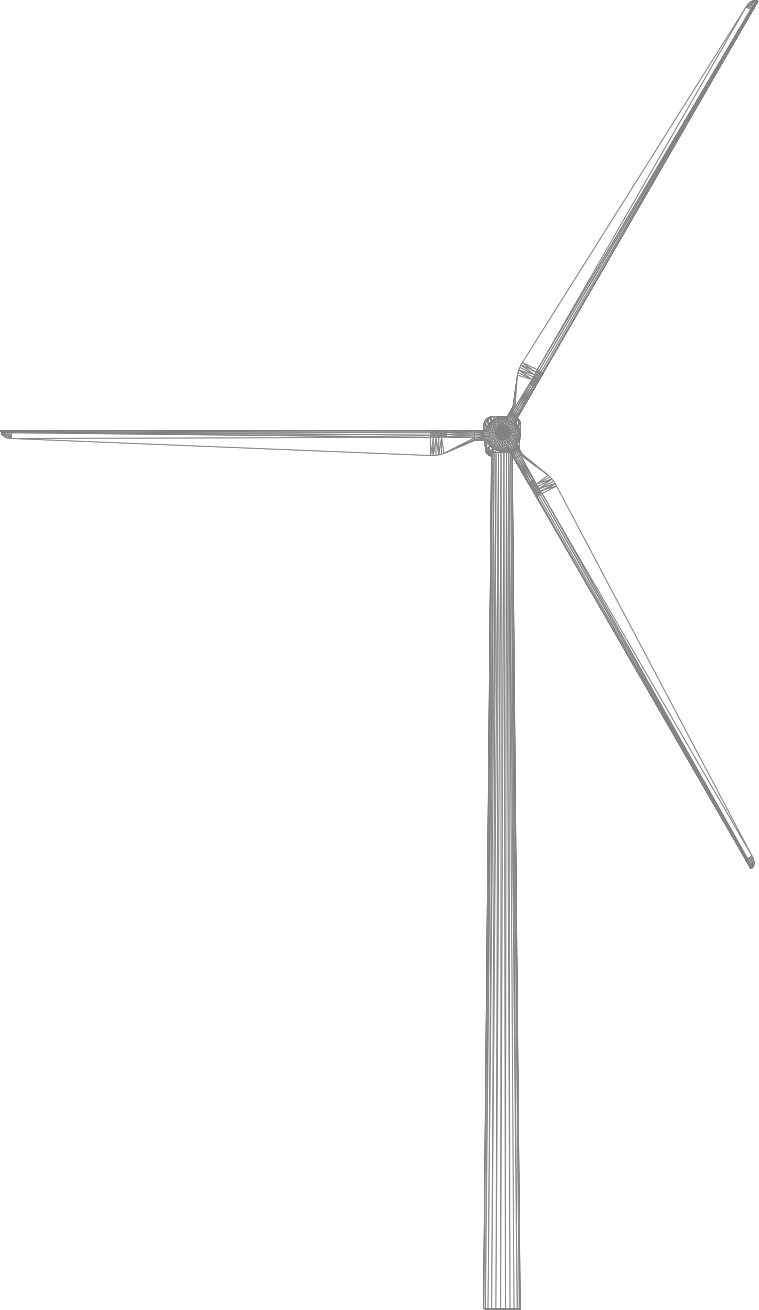
Following that, the vertices and faces are loaded into matplotlib, and a 3D plot is created using plt.plot_trisurf. The background of the 3D plot is set to transparent and the image is thereafter saved as a .png file.
HTML(print_code(plot_trisurface))
def plot_trisurface(file_path, elevation = 0, azimuth = 0, view_height = 0, total_height = 1, show_plot = True):

    V, F = load_and_normalize_obj(file_path, total_height = total_height)

    fig = plt.figure(figsize=(6,6))
    ax = fig.add_subplot(111, projection="3d")

    plt.axis('off')
    plt.grid(visible=None)
    ax.view_init(elev=elevation, azim=azimuth)

    tri = ax.plot_trisurf(V[:, 0], V[:,1], F, V[:, 2], linewidth=0.1, antialiased=True, closed=True)
    tri.set(facecolor = "white", edgecolor = "gray")

    limits = np.array([getattr(ax, f"get_{axis}lim")() for axis in "xyz"])
    lower_bound = np.minimum(0, 2*view_height - total_height)
    upper_bound = np.maximum(total_height, 2*view_height)
    limits[2,:] = [lower_bound, upper_bound]
    ax.set(zlim=limits[2,:], aspect="equal")

    plt.savefig(Path.joinpath(ROOT_DIR, "temp/obj2png.png"), dpi=600, transparent=True)
    if show_plot:
        plt.show()
    else:
        plt.close() # prevent plot from showing
plot_trisurface("../../assets/turbine.obj", azimuth=-90)
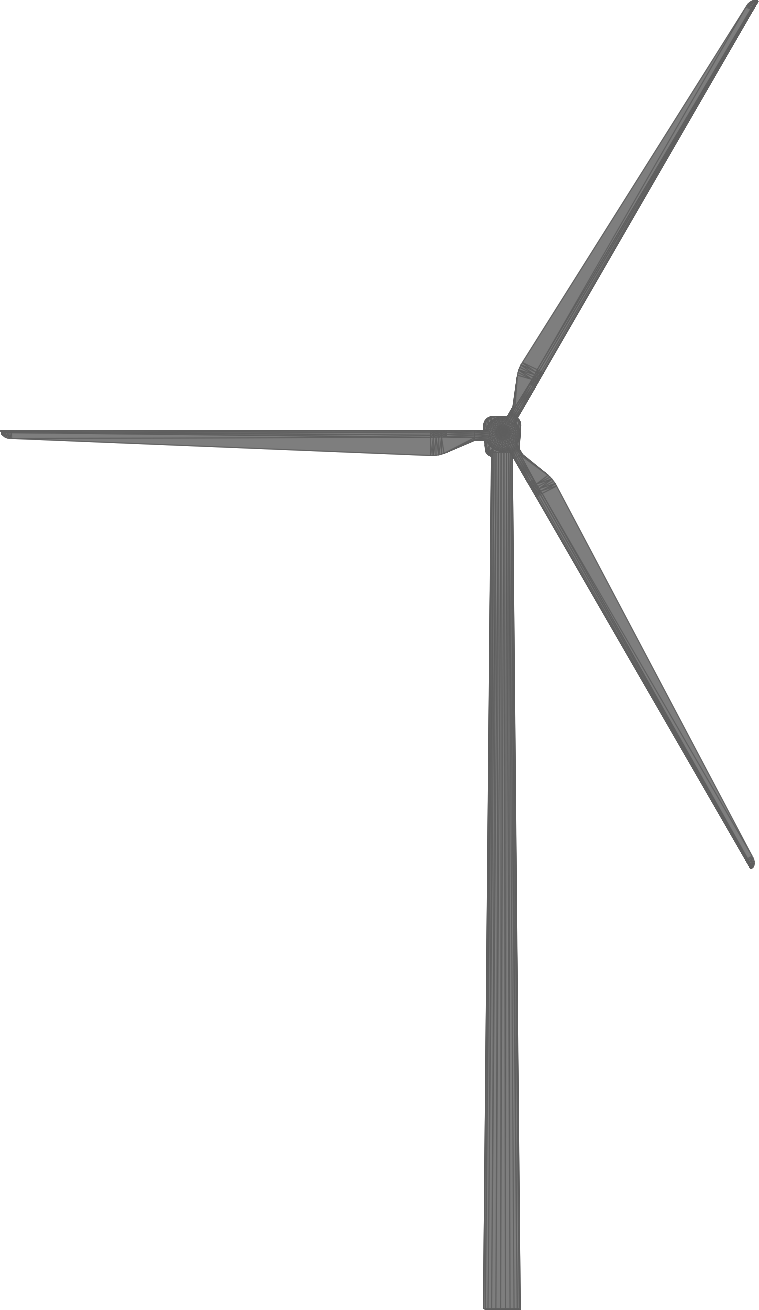
The image needs to be cropped to remove the axis from the plot. This is done be removing the 5 border pixels of the image.
HTML(print_code(crop_image))
def crop_image(file_path, display_image = True):
    pil_image = Image.open(file_path)
    pil_image = pil_image.crop((5, 5, pil_image.size[0]-5, pil_image.size[1]-5))
    np_array = np.array(pil_image)
    blank_px = [255, 255, 255, 0]
    mask = np_array != blank_px
    coords = np.argwhere(mask)
    x0, y0, z0 = coords.min(axis=0)
    x1, y1, z1 = coords.max(axis=0) + 1
    cropped_box = np_array[x0:x1, y0:y1, 0:4]
    pil_image = Image.fromarray(cropped_box, 'RGBA')
    pil_image.save(file_path)

    if display_image:
        display(pil_image)

    return pil_image
pil_image = crop_image("../../temp/obj2png.png")
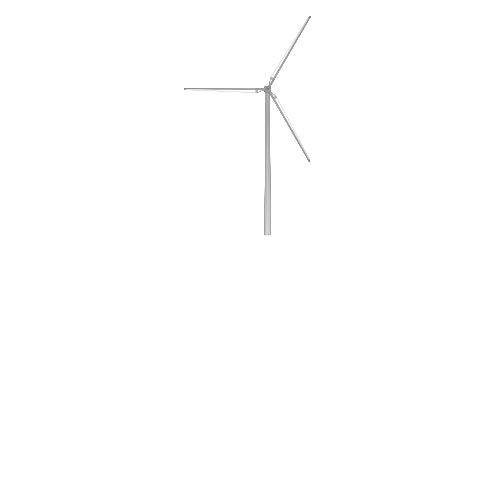
Lastly, the image needs to be adjusted according to the weather conditions of the Google Street View image.
HTML(print_code(adjust_image))
def adjust_image(image_path, brightness = 1, contrast = 1, display_image = True):
    # Load the image using PIL.
    if isinstance(image_path, (pathlib.PosixPath, str)):
        image = Image.open(image_path)
    elif isinstance(image_path, PIL.Image.Image):
        image = image_path
    else:
        print(f"DataTypeError: {type(image_path)} is an unsupported DataType.")

    # Apply the brightness and contrast adjustments to the image.
    enhancer = ImageEnhance.Brightness(image)
    image = enhancer.enhance(brightness)

    enhancer = ImageEnhance.Contrast(image)
    image = enhancer.enhance(contrast)

    # Save or display the adjusted image.
    # image.save("../../temp/obj2png.png")
    image.save(Path.joinpath(ROOT_DIR, "temp/obj2png.png"))
    if display_image:
        display(image)
    return image
image = adjust_image("../../temp/obj2png.png", brightness = 0.5, contrast = 0.5)
Currently, the program applies a fixed 50% reduction in contrast and brightness, as weather data hasn’t been integrated. This configuration is subject to adjustment in future iterations.